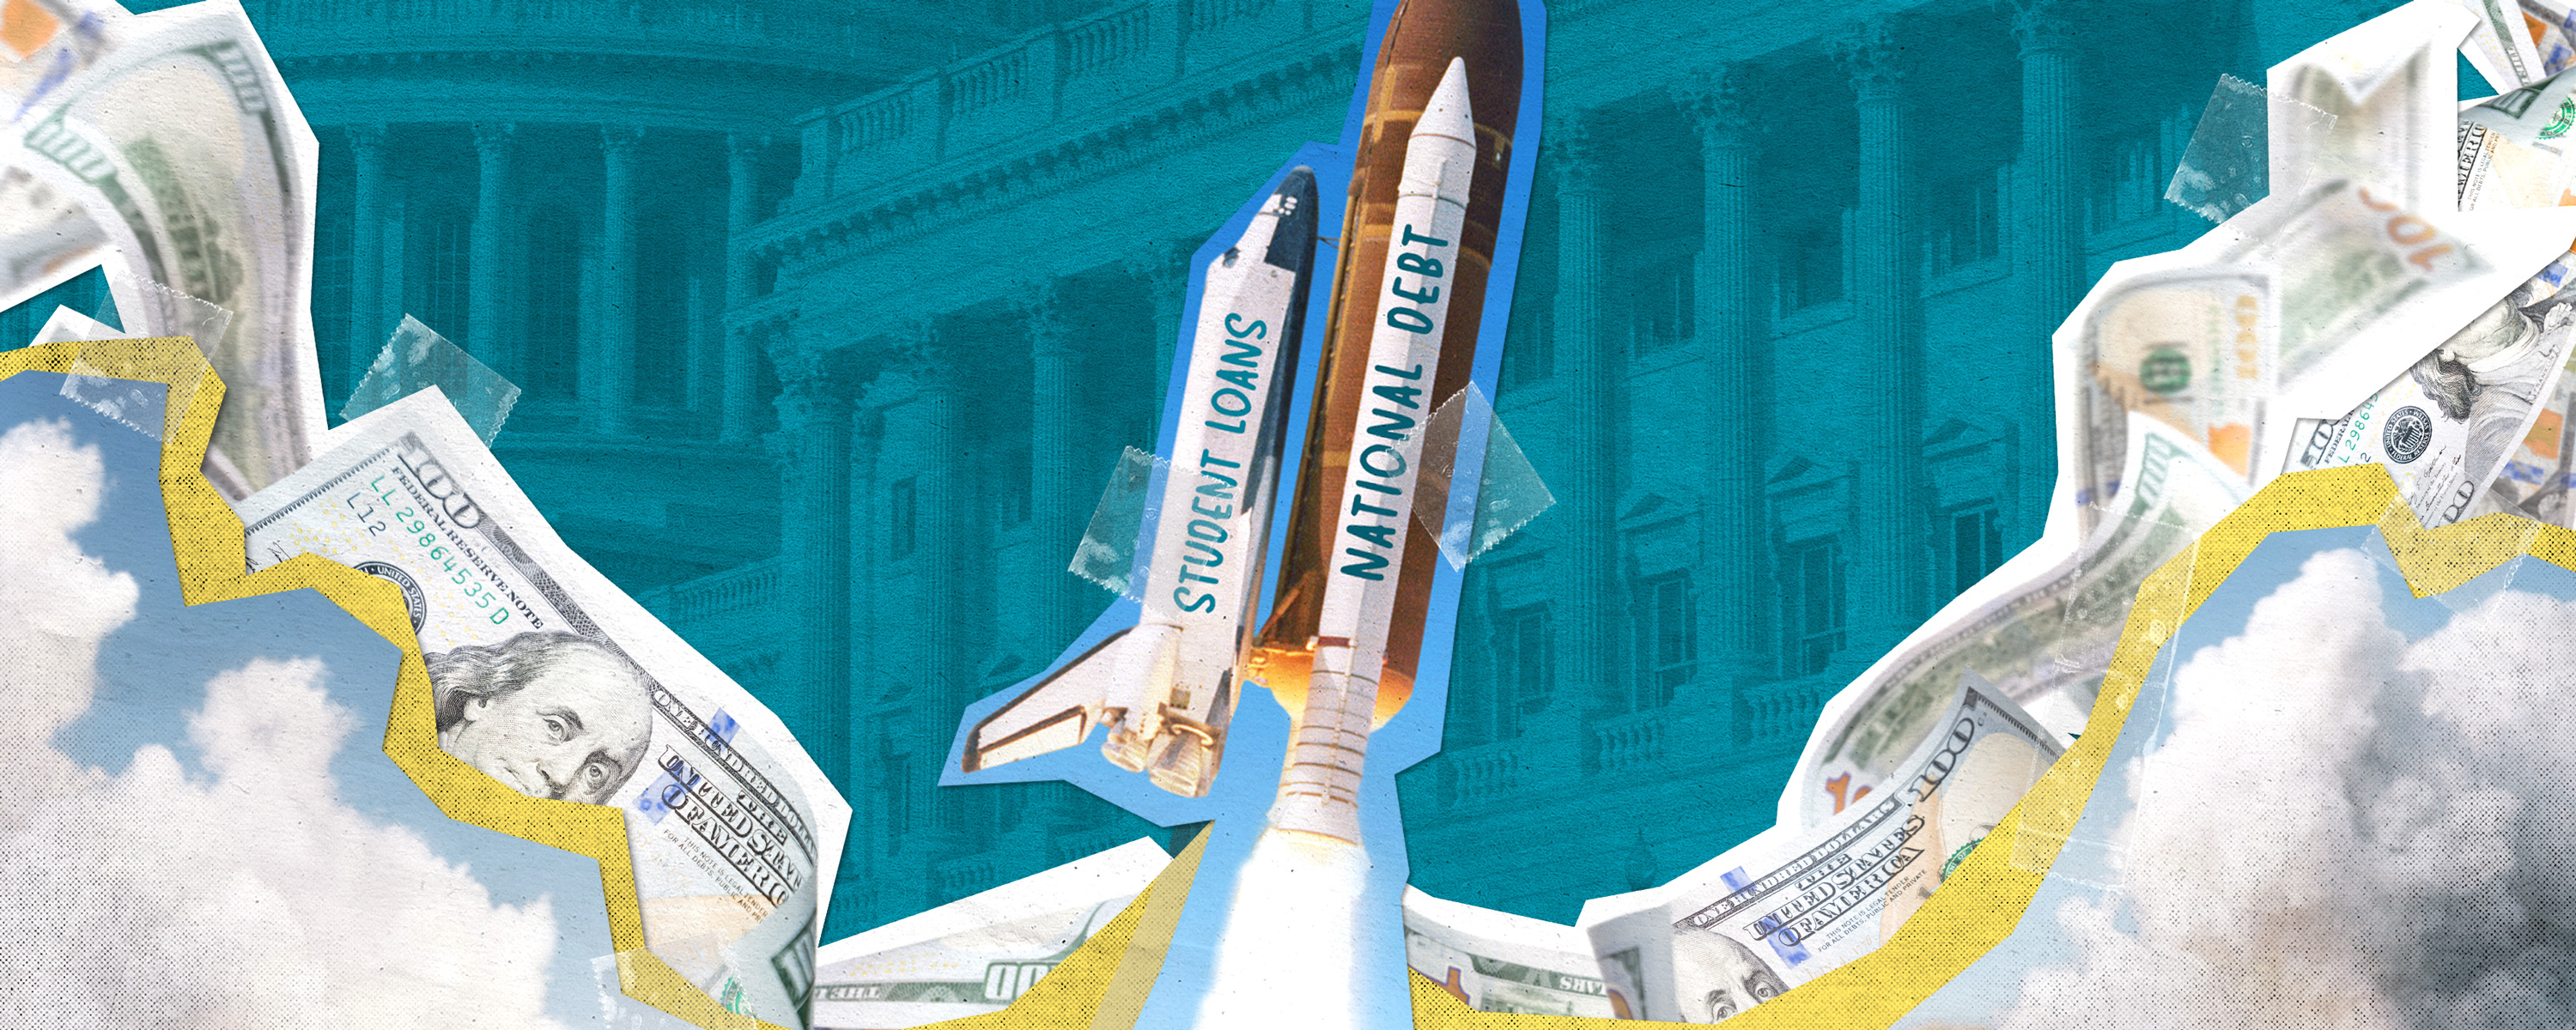
Is the National Debt Making Your Student Loans More Expensive?

National Debt

Ambassador writing program

The Summary

Federal student loans help millions of Americans pay for college and career training. In fact, the federal government holds approximately $1.7 trillion in student loans owed by over 42 million borrowers, making student lending one of its largest financial programs.

Students must pay interest to take out a loan, and these interest rates are directly tied to the government’s borrowing costs. This means the national debt can affect how much you pay for a college degree.

Continue reading to learn more about federal student loans and how the national debt can make them more expensive. 

What Are Federal Student Loans?

Federal student loans are issued by the U.S. government to help students and families pay for tuition, fees, housing, books, and other expenses related to higher education. 

As with credit cards, auto loans, and mortgages, students generally have to pay a price to take out a loan. This price is known as interest, and it is calculated as a percentage of the original loan, called an interest rate. 

Most federal student loans have fixed interest rates, meaning a borrower’s rate does not change after the loan is issued. Borrowers usually begin repaying their loans after graduating or dropping below half-time enrollment. As you can imagine, this means the original interest rate you agreed to when taking out the loan has financial implications well beyond your college years. 

How Does the National Debt Impact Student Loans? 

As the government borrows more and the debt continues to grow, concerns about the nation’s fiscal outlook can raise interest rates for the government and the broader economy. We recently got into what this means for home mortgage rates, and student loans follow a similar trajectory. 

The federal government borrows money by selling Treasury bonds to investors. The interest it pays, called the Treasury yield, reflects how much it costs the government to borrow. In part due to the growing national debt, Treasury yields are currently at extreme highs, making borrowing more expensive.

When the government’s borrowing costs rise, yours do too. That’s because loans for everything from college tuition to buying your first home are based on the yield of a 10-year Treasury bond. By law, the interest rates on federal student loans are set by taking that Treasury yield and adding a fixed percentage point based on the loan type:

  • Undergraduate loans: 10-year Treasury yield plus 2.05%
  • Graduate loans: 10-year Treasury yield plus 3.6%
  • PLUS loans: 10-year Treasury yield plus 4.6% (These loans are available to graduate and professional students and to parents of dependent undergraduate students).

As the national debt grows, so do the government’s borrowing costs. Because rates for new federal student loans are directly tied to the government’s borrowing costs, they will continue to rise as the country takes on more debt. 

What This Means for You.

The impact of rising interest rates on student loans is more than just theoretical.

Take the average undergraduate student who took out a loan of $29,300 during the 2024-25 school year. Due to higher interest rates, they would pay $53 more per month than someone who took out the same loan in the 2021-22 school year. That’s $6,430 more over 10 years, and it’s in part due to America’s growing national debt.

For graduate students, the outcome is even worse. The average grad student who took out a loan of $70,300 in 2024-25 would pay $136 more per month than in 2021-22 — a whopping $16,266 over 10 years!

While the standard length — or “term” — of a student loan is 10 years, like in the examples above, it often takes the average student longer to fully pay down their loans. This leaves borrowers with less money to save for retirement, purchase a home, or cover other expenses.

That means the national debt is not just a number in Washington. It can directly affect how much students and families pay to borrow for college, shaping their financial futures long after graduation. 

To learn more about the national debt and how it can impact you, visit our national debt primer or sign up for our newsletter to get our latest policy explainers.

Q:
A:
Keep Exploring
Pink piggy bank with a US flag and green dollar bills on a pink background.

POLICY

Federal Budget

Care about public policy? You need to understand where the federal government gets - and how it spends - money.

Read More
Pink piggy bank with US flag and green dollar bills on a pink background.

POLICY

National Debt

Care about public policy? You need to understand where the federal government gets - and how it spends - money.

Read More
Two-tiered cake with pink icing, candles, and gold number 67 candles on top.

POLICY

Social Security

More than 71 million Americans rely on Social Security for retirement income, survivors benefits, and disability insurance payments. The program is the single-largest expenditure in the federal budget, making up more than 20% of it. Learn more about how the program works, its funding challenges, and some ways to address them.

Read More
Three smiling young adults stand together in front of a historic stone building with ornate carvings.

Leadership

Leadership Programs

Our programs and events help you stay informed and get involved. Want to learn more about issues like Medicare, student loans, and Social Security? Check out our leadership and events section.

Read More
The United States Capitol building with an American flag and purple sky with clouds.

Policy

Policy Library

Learn more about our country's biggest challenges.

Read More
ARTICLES
A bill passed by Congress to fund all or parts of the federal government for a limited time. It can keep the government operating if it fails to pass regular, full-year funding bills by the October 1st deadline.
Continuing Resolution (CR)
The point at which Social Security retirement benefits will only be funded by payroll taxes because the Old-Age Survivors Insurance (OASI) Trust Fund has run out. This trust fund closes the gap between revenue from payroll taxes and the total funding needed for monthly benefits. When we hit this point, an automatic 22% cut to benefits will be triggered. Up-to-date projections estimate this will occur in 2032.
Social Security Insolvency
The federal budget is the itemized plan for public expenditures of the federal government. This includes mandatory and discretionary spending. The budget is compiled annually and is named after the proceeding fiscal year, which runs from Oct. 1 to Sept. 30. If a budget is not agreed upon by the start of the fiscal year, a government shutdown will be triggered unless Congress passes a continuing resoultion, which provides funding at existing levels for a period of time to allow for negotiations to continue.
Federal Budget
This ratio compares the federal government debt of a country to the country's gross domestic product (GDP), in other words, what it owes to what it produces. Expressed as a percentage, the higher the debt-to-GDP ratio of a country the more likely it is that a country will face economic challenges due to its debt.
Debt-to-GDP Ratio
The federal debt is the cumulative amount the federal government owes to bondholders, both foreign and domestic. This represents the total, historical difference between federal spending and revenue.
National Debt
The federal budget deficit is the annual difference between the federal government’s revenue and how much it spends.
Budget Deficit
GDP is the total monetary value of consumer goods and services within a country's economy. This calculation considers consumer spending, government spending, private domestic investment, and a country's imports and exports.
Gross Domestic Product (GDP)
The U.S. federal government's sole source of income is tax revenue, which is primarily composed of individual income taxes, corporate income taxes, and payroll taxes. Other sources of tax revenue include excise taxes and estate taxes.
Tax Revenue
These bills provide and place limits on an agency's budget authority, the ability to spend government funds. There are 12 annual appropriations bills and occasional supplementary appropriations bills that obligate federal funds for specific purposes.
Appropriations Bills
Authorizing legislation is a prerequisite for Congress to appropriate budget authority, or the ability to spend government funds for various programs. Authorization laws also act as guidance on the appropriate level of funding to be set aside for specific programs. This might be in setting a limit, or it may simply authorize “such sums as may be necessary.”
Budget Authorizations
A congressional budget resolution establishes topline spending and deficit limits for the following fiscal year. Although not law, because it's not signed by the president, budget resolutions are enforceale using the rules of either chamber. By law, a budget resolution is to pass the House and Senate by April 15 of each year, which rarely happens.
Budget Resolution
The president's budget request kicks off the annual budget process and provides a breakdown of how the president would like Congress to enact tax and spending laws. This request is due on the first Monday in Feburary but is normally provided late.
Budget Request
Discretionary spending is the portion of the federal budget that Congress debates every year. There are 12 components of discretionary spending, and these are usually broken down into defense and non-defense spending.
Discretionary Spending
The programs that Congress is required to fund make up mandatory spending. This includes programs like Social Security, Medicare, and interest payments on the debt.
Mandatory Spending
What you pay for your own medical care.
Out-of-pocket Payments
Within the context of the Hospital Insurance (HI) Trust Fund, insolvency means that Medicare is unable to cover the full cost of Part A (hospital care) benefits.
HI Trust Fund Involvency
Chronic conditions are diseases and conditions that usually last for 3 months or longer, such as diabetes, heart disease, hypertension, and cancer.
Chronic Diseases
The percentage of the costs of a healthcare service that you pay (e.g., 20%). Coinsurance kicks in after you've paid your deductible.
Coinsurance
The amount you pay for healthcare services before your insurance begins to cover expenses.
Deductibles
Examples include disabilities that qualify the individual for Social Security Disability Insurance (SSDI) benefits (i.e., unable to engage in “substantial gainful activity” because of a medically-determined physical or mental impairment expected to last at least 12 months or until death), end-stage renal disease (ESRD), and amyotrophic lateral sclerosis (ALS).
Long-term Disabilities
For every current recipient of Social Security, there are several active workers whose taxes are transferred directly to retirees. When Social Security began, there were dozens of workers per every recipient. That number has shrunk to just under three workers for every active Social Security recipient.
Worker-to-Beneficiary Ratio
As a covered worker, you pay Social Security taxes up to the taxable maximum. In 2025, that amount is $176,100. Since Social Security was never meant to function as a retirement program, wages subject to taxation were capped so that high-income individuals did not end up with Social Security payments many times what would be necessary to prevent poverty in old age.
Taxable Maximum
As the spouse of a Social Security recipient, you are entitled to additional benefits of up to one-half of their full benefits. You do not have to have a work history to receive this payment. If you have worked and are owed Social Security benefits, you get the maximum of what you are owed or your calculated spousal benefit.
Spousal Benefit
All funds in the OASDI trust funds are invested in "special issue securities" specifically created for Social Security. In effect, they are IOUs that the government pays to itself.
Special Issue Securities
In the context of Social Security, the "replacement rate" or "replacement ratio" is the percent of pre-retirement earnings that Social Security recipients can expect to receive. Median-income retirees typically expect around a mid-thirty percent replacement rate, low-income retirees get closer to fifty percent, and high-income retirees typically receive a mid-twenty percent replacement rate.
Replacement Rate
Every covered worker pays a payroll tax that includes a combined 12.4% up to the taxable maximum.
Payroll Tax
The primary insurance amount is the sum of three separate percentages of the AIME. It is the initial benefit a retiree receives, and it increases with any future COLA.
PIA
The Old Age and Survivors Insurance Trust Fund is what most people picture when they hear "Social Security." This trust fund pays benefits to retired workers and their spouses and dependents. It also pays benefits to the survivors of deceased retirees.
OASI
OASDI stands for Old Age, Survivors, and Disability Insurance. It encompasses both the retirement portion of Social Security (OASI) and the disability insurance program (DI).
OASDI
The full retirement age began at 65 but is slowly increasing to the final age of 67 for those born in 1960 or later.
Full Retirement Age
Employers whose workers pay into Social Security also contribute 6.2% of each worker's payroll taxes. While it may seem like employers pay for half of all benefits, economists typically assume that any taxes paid by employers are in effect paid by employees, since in absence of the mandatory taxes, the employees would have higher wages by roughly the same amount.
Employer Contribution
Every covered worker contributes 6.2% of their paycheck in OASDI payroll taxes, which constitutes the "employee contribution" toward Social Security.
Employee Contribution
Future Social Security recipients can elect to retire early at 62 and receive reduced benefit payments. For more, click here.
Early Retirement Age
DI stands for Disability Insurance. While most people associate Social Security with retirement, it also technically encompasses disability insurance payments to almost nine million Americans.
DI
The total amount of any employee's pay that is taxed by Social Security payroll taxes. All wages below the taxable maximum are covered earnings. About 94% of workers fall under the taxable maximum every year.
Covered Earnings
The cost of living adjustment (COLA) is an annual adjustment for Social Security benefits designed to prevent losses in beneficiaries' purchasing power due to inflation.
COLA
Social Security recipients are not limited to retirees. In the OASI system, spouses are entitled to a spousal benefit, as are dependents of beneficiaries who are under the age of 19.
Beneficiary
Stands for average indexed monthly earnings. When a worker retires, the Social Security Administration summarizes up to 35 years of the worker's lifetime earnings and adjusts them for wage inflation. This number is then used to calculate the retiree's "PIA" or primary insurance amount.
AIME